Retail Compliance
Gain critical insight into program delivery by knowing exactly which displays made it to market
Audit Display Installation
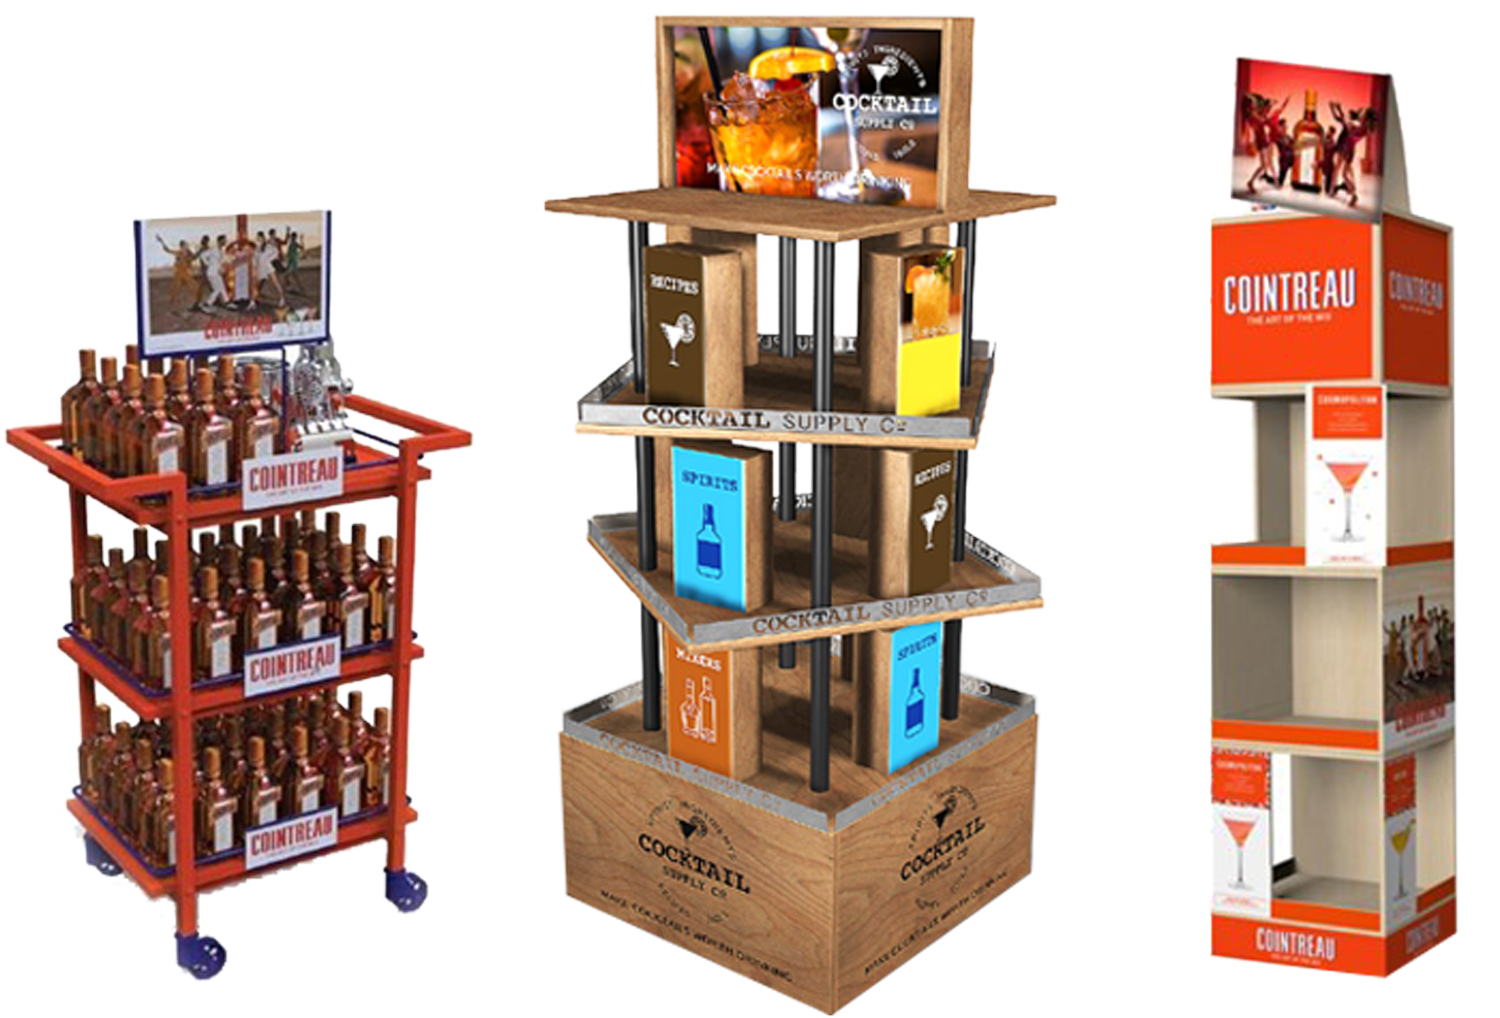
Ensure displays are correctly merchandised and properly configured
Refine Sales Attribution
Confidently determine which specific designs, locations, promotions, and banners contribute most to your lift
Extract Planogram Insights
Analyze planogram accuracy, pricing, and share-of-shelf across retail banners
Merchandising Technology / Retail Compliance

Finally, Transparency in Compliance Execution
According to a survey by Shop! Association, there’s a disconnect between CPG expectations and reality when it comes to compliance execution. The survey indicated that while CPG marketers assumed their retail display compliance rates to be nearly 70%, actual display compliance rates averaged no higher than 40%.
IMS has developed several solutions including asset-tracking, in-store audits, and planogram analysis to address this discrepancy. These solutions reduce waste across over-produced campaigns, while also allowing marketers to have data-informed discussions with field sales teams and distributors to improve compliance in real-time, resulting in increased in-market presence and corresponding sales lift.
Did it get there?
- Time in supply chain
- Time in in transit
- Arrival time and tenure in market
- Which distributors, regions, and field teams are top / low performers
Is it right?
- Is it merchandised correctly?
- Has it been setup correctly?
- Are my products in stock?
- Is the retailer adhering to the plannogram?
- What does it look like at retail?
What it Does:
Easily track your displays for real-time visibility across your supply chain, without requiring retailers to install expensive networking equipment.
Ideal for high-value asset control, or where supply chain visibility is diminished due to multi-tier distribution processes.
How it Works:
Install Beacons
During production, IMS installs discreet, cost-effective, self-reporting beacons.
Transmit GPS Data
GPS coordinates of your displays are collected from the beacon itself, or crowd-sourced via personal devices.
Evaluate Performance
IMS aggregates and reports location data in a customized dashboard.
What it Does:
Gain insight into what’s really happening in the store. App-guided associates visit stores, following prompts to take pictures and answer questions that paint a picture of your consumers’ retail experience.
IMS develops the surveys and audit programs necessary to provide actionable insights delivered via customized dashboards for your field, sales, and marketing teams.
How it Works:
Design Survey
Complete Observation
Provide Feedback
What it Does:
Use AI-analyzed images of in-store product facings to learn more about how your products appear on the shelf. IMS helps you analyze this data to facilitate more informed discussions with your retail sales and marketing partners.
Leverage dashboard insights to understand how differences in shelf position, facings, and assortment may be impacting sales.
How it Works:
Provide Category Info
Work with IMS experts to determine shelf evaluation criteria. Provide necessary image and SKU reference inputs for use during analysis.
AI-Driven Analytics
App-guided associates follow survey prompts to acquire images of shelf facings. Images are fed through AI image recognition software for analysis.
Derive Insights
Customized Reporting Dashboards
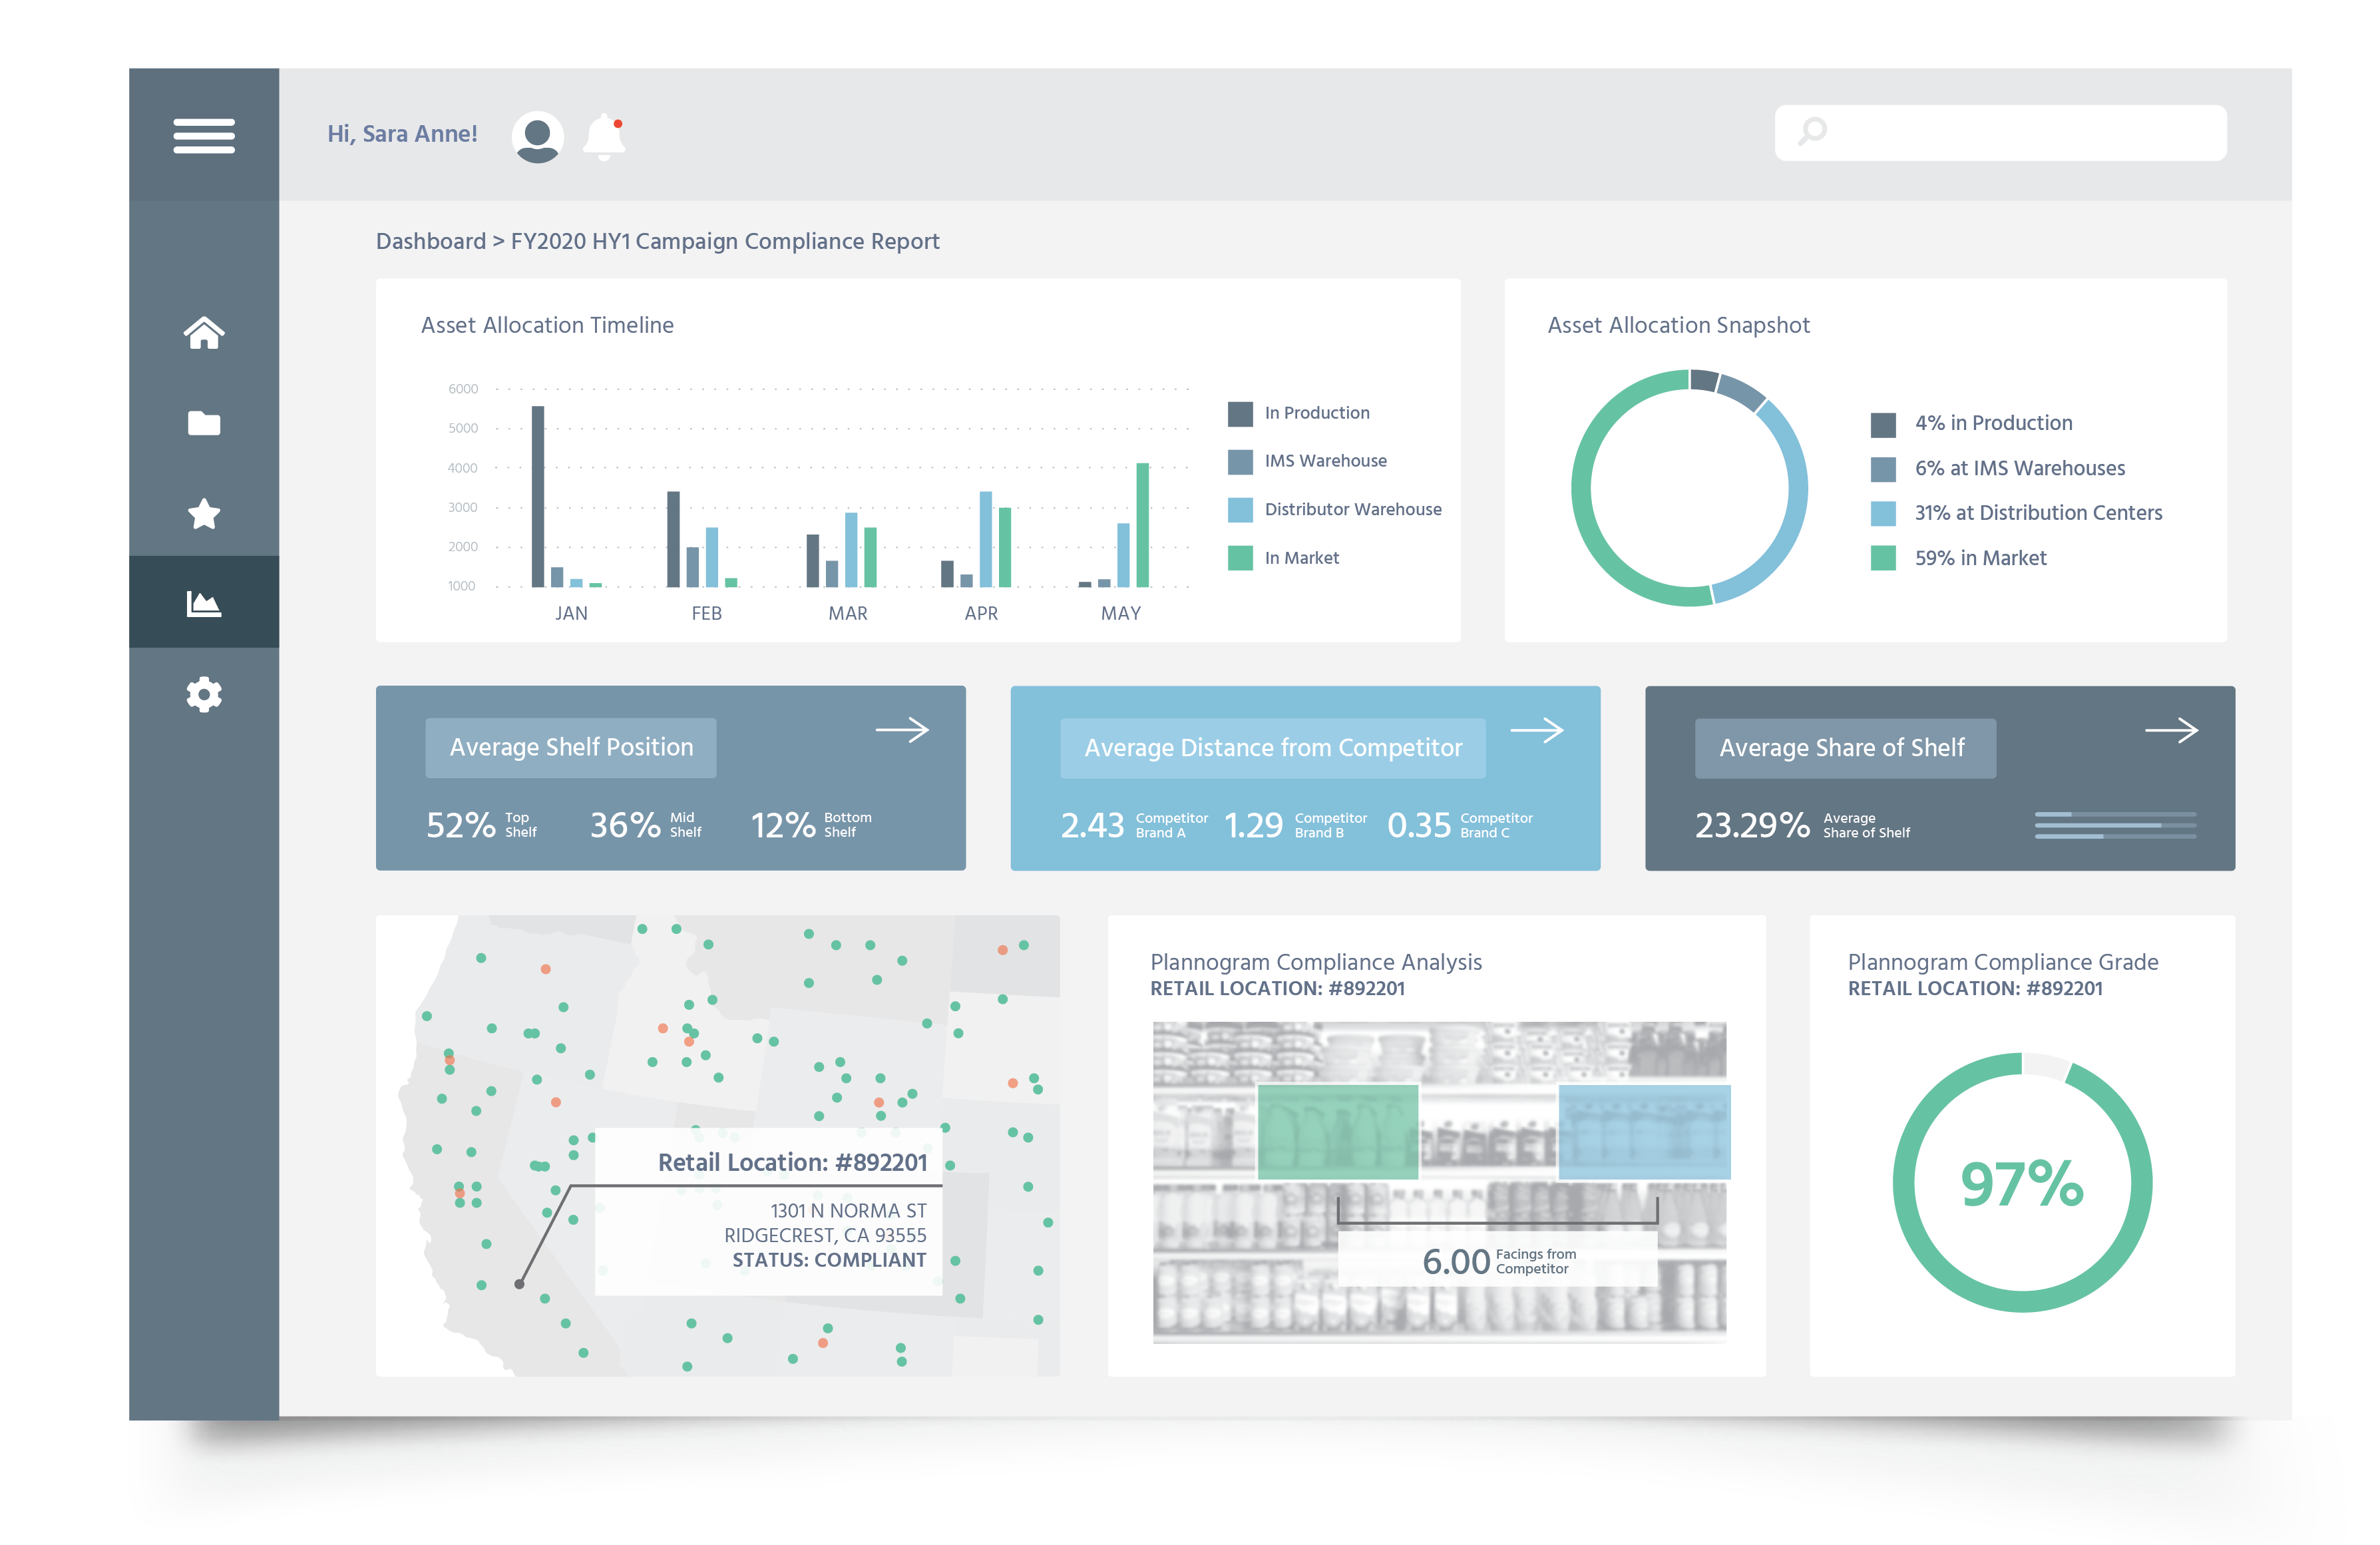
IMS generates a single source of truth by integrating data feeds from fit-for-purpose compliance tools with IMS-managed campaign execution data, delivering unprecedented accuracy and transparency of your execution performance at retail.
User-specific dashboard views provide at-a-glance answers for field, sales, and marketing stakeholders, delivering actionable insights in real-time.

Impact Revenue Directly with Data-Informed Compliance Conversations
What is the True Cost of Non-Compliance?
The opportunity cost of low compliance rates goes beyond budget loss from unit waste, more importantly it includes missed sales opportunity from unexecuted displays.
In the calculator, we’ve included default values for the slider positions based on our own clients’ typical campaigns, as well as industry estimates such as 40% compliance rates and 24% expected sales lift. Slide the bars to reflect your own average campaign inputs to determine your true cost of non-compliance.
